Health care should be accessible and affordable for all, regardless of paycheck, address, race, ethnicity, gender, or disability. Minnesota has a history of strong investments in health and well-being, however there is more work to do in making sure that everyone can get the care they need. The cost of health care can be prohibitive even for those with insurance. Premiums, deductibles, co-pays, services that aren’t covered, and high out-of-network costs erode people’s ability to afford care.
Lack of affordable, high-quality care means people miss out on life-saving preventative care and treatment for chronic conditions.[1],[2] When people do receive treatment, high costs and unexpected bills can lead to financial distress and even bankruptcy.[3] No one should have to choose between getting the health care they need and paying rent or buying food.
The Affordable Care Act (ACA) and Minnesota health care legislation have taught us many valuable lessons about the benefits of policies to ensure more people have health insurance. Public investment in health care leads to better health outcomes and financial stability, especially for low-income folks and Black, Indigenous and People of Color (BIPOC), who are disproportionately likely to lack health care coverage and experience worse health outcomes.[4] Health insurance coverage helps people get the health care they need to survive and thrive.
This issue brief takes a look at key ways that barriers to getting health care, such as lack of continuous health insurance and high out-of-pocket costs, result in worse health outcomes and financial distress. It also looks at how smart public policies have resulted in more people having affordable health care, make folks healthier, and strengthen individuals and families.
Health insurance improves health and saves lives

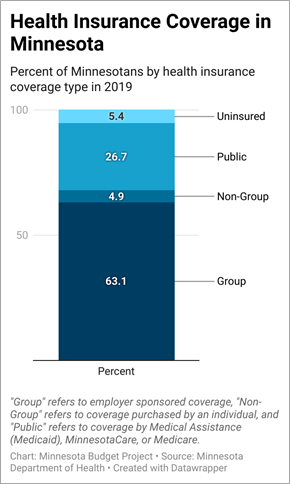
Nearly 95 percent of Minnesotans had health care coverage in 2019 through a mix of options including group coverage (63.1 percent); public plans including Medicaid (called Medical Assistance in Minnesota), MinnesotaCare (Minnesota’s affordable health insurance option), and Medicare (26.7 percent); and non-group coverage purchased through the private market or through the MNsure marketplace (4.9 percent). While overall coverage rates are high for Minnesota, some groups are left behind. For example, just 84 percent of Latinx folks and 88 percent of Native American folks had health insurance in 2019.[5]
Having health insurance coverage isn’t a luxury; it saves lives. Uninsured folks are less likely to have a primary care doctor and seek preventative care services, and are more likely to have unmet medical needs.[6] Lack of health insurance also increases the rates of individuals seeking primary care from emergency rooms instead of using preventative services from regular doctor visits. For these reasons, lack of health insurance can lead to premature deaths from preventable or treatable conditions.[7]
A legacy of systemic racism has limited BIPOC folks’ access to health insurance and high quality care.[8] For example, residential segregation has decreased access to health care facilities among low-income and BIPOC communities, making it harder to obtain health care. A lack of education and job opportunities has limited many BIPOC folks’ ability to get higher-paying jobs with benefits like health insurance. Racial disparities in obtaining affordable health insurance and health care are very real, and contribute to worse health outcomes. In most states, including Minnesota, Black and Native American people are more likely than white, Latinx, and Asian people to die of treatable conditions such as diabetes and hypertension.[9] Race and ethnicity should not limit anyone’s ability to get the care they need.
Even with insurance, the cost of health care can be too much

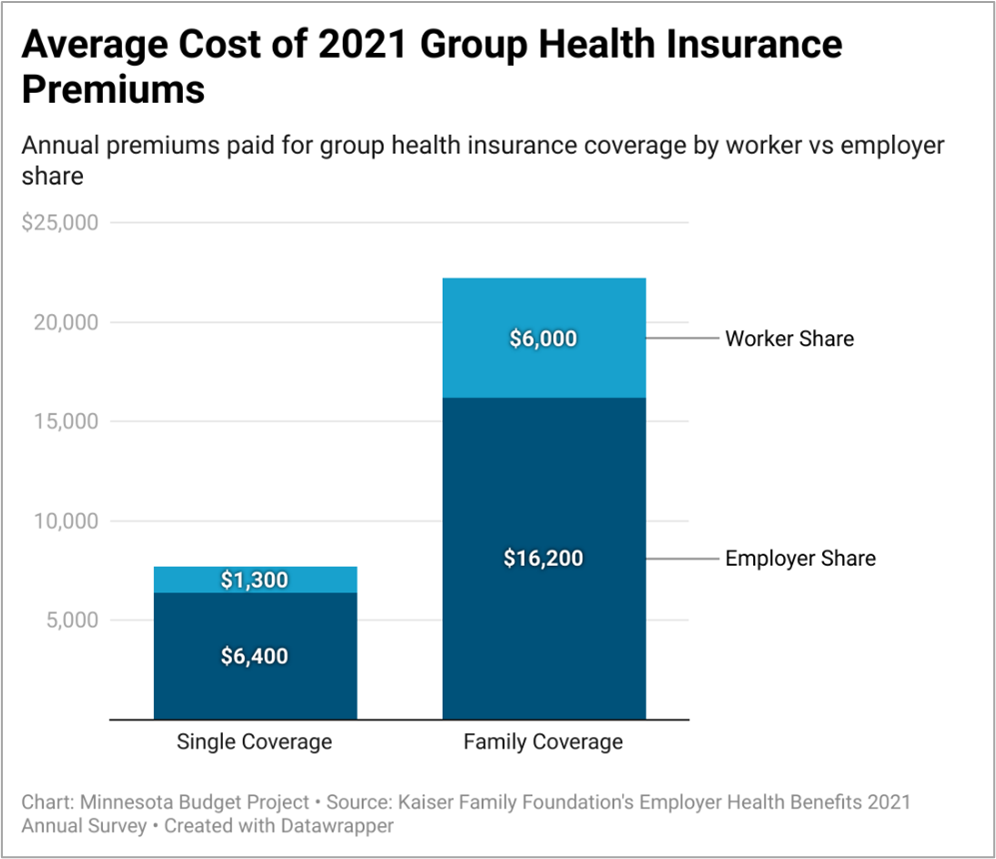
Even those with health insurance shoulder the cost of medical care through premiums, deductibles, co-pays, co-insurance, and other costs. According to the Kaiser Family Foundation’s 2021 Employer Health Benefits Survey, the full cost of average annual premiums for employer-sponsored health insurance plans were about $7,700 for single coverage and $22,200 for family coverage. On average, workers paid 17 percent of the premium for single coverage and 28 percent for family coverage. This amounts to about $1,300 in annual premium costs for single coverage and $6,000 for family plans.[10]
Premiums aren’t the only health care costs insured folks face. Nearly 30 percent of workers were in a High Deductible Health Plan in 2021.[11] Deductibles are the health care costs individuals and families must pay before insurers start covering the costs of care. In 2022, the Internal Revenue Service defines these as any plans with deductibles starting at $1,400 for individuals and $2,800 for families, but they can be much higher. Plans also include an out-of-pocket maximum, which is the most an individual or family can be asked to pay for their health care costs before insurance must pay for in-network health care costs. For 2022, the legal limits for out-of-pocket maximums are $7,050 for individuals and $14,100 for families.[12] The out-of-pocket maximums that people may have to pay for out-of-network services can be even higher.
While many high deductible plans come with Health Savings Accounts (HSAs) or Health Reimbursement Accounts (HRAs), which are tax-free accounts designated for medical expenses, they aren’t always enough to make receiving medical care affordable. Among those with any type of employer- sponsored coverage, 46 percent of adults struggle to pay out-of-pocket costs.[13] In addition, many struggle to pay for dental, hearing, and vision care, and for prescription drugs, which may not be covered by their medical insurance.
Lack of dental coverage has very real consequences. Oral health problems are associated with other conditions such as diabetes and heart disease, and untreated dental issues can result in severe health problems.[14] In 2018, nearly half of Medicare beneficiaries (47 percent) did not have dental coverage and the same proportion had not been to the dentist in the past year. These numbers were even higher for BIPOC folks. Nearly 70 percent of Black and over 60 percent of Hispanic folks covered through Medicare had not been to a dentist in the past year. Among low-income folks covered through Medicare, nearly 3 in 4 had not seen a dentist in the past year.[15] Dental health plays an important role in overall health, and the number of folks without access to care is simply unacceptable.
Unaffordable care leads to medical debt
The cost of care is overwhelming for many in the U.S. Nearly 40 percent of U.S. adults ages 19 to 64 had problems paying medical bills or had medical debt in 2021. While folks without insurance were more likely to have problems paying for care or have debt (50 percent), 36 percent of those with insurance also had trouble paying medical expenses.[16]
The sheer amount of medical debt is staggering. As of June 2020, Americans held an estimated $140 billion in medical debt. While total household debt decreased since 2014 when some ACA provisions were enacted, the share of medical debt in collections is still higher than all other types of household debt combined.[17]
As of 2017, nearly 1 in 5 U.S. households had medical debt. The percent of households with medical debt is higher among:
- households with children (24.7 percent vs 16.5 percent without),
- Black households (27.9 percent vs 17.2 percent for white, non-Latinx),
- Latinx households (21.7 percent vs 18.6 percent non-Latinx), and
- households with a family member living with a disability (26.5 percent vs 14.4 percent without).
While households are equally likely to have medical debt whether their incomes were above or below the poverty line, low-income households were much more likely to have high levels of medical debt (defined as above 20 percent of their annual income). Of households with incomes below the poverty line, 11.3 percent had high medical debt versus 3 percent of those with incomes above the poverty line.[18] Much of the burden of high medical debt falls to those who can least afford it.
Medicaid expansion improves health and financial stability
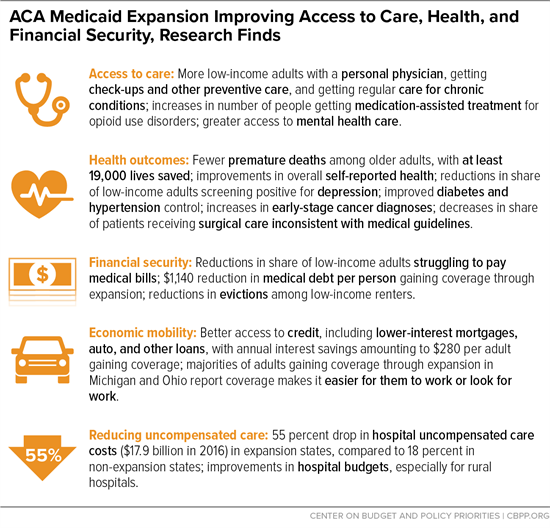
The ACA gave states the ability to expand health care coverage through Medicaid to non-disabled, low-income adults beginning in 2014, with the federal government paying 90 percent of the cost. Minnesota had long been a leader in providing health care options for very low-income individuals, and Medicaid expansion was an opportunity to build on that legacy. To date, 38 states (including Minnesota) and D.C. have implemented Medicaid expansion.[19],[20] Medicaid expansion has substantially increased access to care and reduced medical debt in states that adopted it. States that expanded Medicaid have higher rates of insurance coverage among low-income and BIPOC folks, leading to higher use of preventative care. Medicaid expansion saved an estimated 19,200 lives of adults aged 55 to 64 through increased use of health care services between 2014 and 2017. In contrast, the decision not to expand Medicaid in 12 states led to 15,600 premature deaths.[21]

The economic benefits have been significant as well. In its first two years, Medicaid expansion reduced medical debt by $3.4 billion.[22] While medical debt has fallen overall since 2014, the decrease was 34 percentage points larger in states that expanded Medicaid.[23] Medicaid expansion also lowered the amount of debt that people were unable to pay, which led to better credit scores and $520 million in interest savings among folks who received medical treatment.[24]
The benefits of expanding Medicaid extends to health care providers as well as patients. The amount of care for which hospitals did not receive payment fell by $6.2 billion in Medicaid expansion states from 2013 to 2015.[25] This had huge benefits for rural hospitals, which were 81 percent less likely to close in expansion states compared to non-expansion states, ensuring more people could get the care they needed in their own communities.[26]
Continuous health insurance coverage has many benefits
Folks who have continuous health insurance coverage for more than a year are more likely to seek regular and preventative care and have their medical needs met.[27] Unfortunately, many people who receive health care through Medicaid can lose their health insurance coverage during the year.
People can lose Medicaid coverage for many reasons, such as having extra earnings one month, not getting notifications and paperwork after a move, and difficulties filling out and returning paperwork. Prior to the COVID pandemic, approximately one in 10 Medicaid recipients lost coverage and then re-enrolled (a process known as “churn”) within one year. Of those who were disenrolled and re-enrolled, over 40 percent re-enroll within three months.[28] This is problematic for many reasons, including folks missing out on preventative and ongoing care.
In addition to the human costs, the cycle of churn comes with economic costs. States often end up paying for more expensive emergency care because folks couldn’t get their regular health care while they were without health insurance.[29] In addition, it can cost hundreds of dollars to re-enroll someone in Medicaid.[30] Money that could be going to health care is instead spent on unnecessary processing of applications.
Due to federal legislation passed during the pandemic, this cycle of churn has stopped temporarily. States are required to ensure folks enrolled in Medicaid keep their coverage until the end of the federally declared public health emergency, meaning states must extend coverage at least through April 30, 2022.[31] While the number of folks covered by Medical Assistance rose by about 18 percent between February 2020, before the pandemic hit and the public health emergency was declared, and June 2021, the number of monthly applications fell by about 27 percent.[32],[33] This means fewer people are losing their health care coverage, the state is wasting fewer resources on churn, and more people are getting the health care they need to survive and thrive. Once this coverage protection ends, states must carefully consider how to begin processing renewals so that folks who are eligible but face barriers such as address changes, homelessness, and difficulty navigating the renewal process don’t lose their health insurance coverage.
Affordable, accessible care helps us all
Policymakers at the state and federal levels must build on our successes and learn from the shortcomings in our health care system. Health care is a human right, and everyone deserves to have high-quality, affordable health coverage that meets their needs, regardless of income, location, race, ethnicity, gender, or disability. The benefits of having health insurance and health care range from better overall health to financial stability, work and school achievement, and more. When the people we live, work, and interact with can get the care they need at a price they can afford, we all win. Removing barriers to making health care affordable and accessible is both morally right and essential for our future.
[1] National Center for Health Statistics, Health Insurance Continuity and Health Care Access and Utilization, May 2016.
[2] Minnesota Department of Health, Disparities in Premature Death Amenable to Health Care, 2011 to 2015, May 2019.
[3] Journal of Public Economics, Health insurance and the consumer bankruptcy decision: Evidence from expansions of Medicaid, August 2011.
[4] Center on Budget and Policy Priorities, Medicaid Expansion: Frequently Asked Questions, June 2021.
[5] Minnesota Department of Health, Health Insurance in Minnesota, 2019.
[6] National Center for Health Statistics, Health Insurance Continuity and Health Care Access and Utilization, May 2016.
[7] Minnesota Department of Health, Disparities in Premature Death Amenable to Health Care, 2011 to 2015, May 2019.
[8] Minnesota Department of Health, Advancing Health Equity in Minnesota: Report to the Legislature, February 2014.
[9] The Commonwealth Fund, Achieving Racial and Ethnic Equity in U.S. Health Care, November 2021.
[10] Kaiser Family Foundation, 2021 Employer Health Benefits Survey, November 2021.
[11] Kaiser Family Foundation, 2021 Employer Health Benefits Survey, November 2021.
[12] U.S. Centers for Medicare and Medicaid Services, High Deductible Health Plan (HDHP), accessed January 2022.
[13] Kaiser Family Foundation, Americans’ Challenges with Health Care Costs, December 2021.
[14] Center for Disease Control and Prevention, Oral Health Conditions, November 2020.
[15] Kaiser Family Foundation, Medicare and Dental Coverage: A Closer Look, July 2021.
[16] The Commonwealth Fund, As the Pandemic Eases, What Is the State of Health Care Coverage and Affordability in the U.S.?, July 2021.
[17] Stanford Institute for Economic Policy Research, America’s medical debt is much worse than we think, July 2021.
[18] U.S. Census Bureau, 19 percent of U.S. Households Could Not Afford to Pay for Medical Care Right Away, April 2021.
[19] Kaiser Family Foundation, Status of State Medicaid Expansion Decisions: Interactive Map, January 2022.
[20] Wisconsin did not opt-in to Medicaid expansion but covers low-income adults through another mechanism.
[21] Center on Budget and Policy Priorities, Medicaid Expansion: Frequently Asked Questions, June 2021.
[22] National Bureau of Economic Research, Medicaid and Financial Health, November 2017.
[23] JAMA, Medical Debt in the US, 2009-2020, July 2021.
[24] National Bureau of Economic Research, Medicaid and Financial Health, November 2017.
[25] The Commonwealth Fund, The Impact of the ACA’s Medicaid Expansion on Hospitals’ Uncompensated Care Burden and the Potential Effects of Repeal, May 2017.
[26] Health Affairs, Understanding the Relationship Between Medicaid Expansions and Hospital Closures, January 2018.
[27] National Center for Health Statistics, Health Insurance Continuity and Health Care Access and Utilization, 2014, May 2016.
[28] Kaiser Family Foundation, Medicaid Enrollment Churn and Implications for Continuous Coverage Policies, December 2021.
[29] Minnesota Department of Human Services, Medical Assistance coverage, April 2016.
[30] Health and Human Services, Evaluating State Options for Reducing Medicaid Churning, July 2015.
[31] Georgetown University Health Policy Institute, Secretary Becerra Extends the PHE: What Does This Mean for Medicaid and the Continuous Enrollment Provision?, January 2022.
[32] These numbers include Medical Assistance and CHIP. Disaggregated data were not available. Complete national data were not available.
[33] U.S. Centers for Medicare and Medicaid Services, State Medicaid and CHIP Applications, Eligibility Determinations, and Enrollment Data, 2021.