Executive Summary
No individual person or business alone can provide an adequate supply of safe and affordable housing, quality schools, or a health care system. We pool our resources as a society so that we can have the safe roads and bridges, the skilled and healthy workforce, and the communities we want for ourselves and our families.
State government is a partner with the nonprofit sector, the business community and Minnesota’s residents in building a state with a high quality of life in which all people have the opportunity to succeed. Public investments can help ensure that those who face more serious challenges, including low-income people, can provide a decent standard of living for their families. Minnesota has some of the nation’s widest disparities in well-being between its white residents and people of color, and here too public investments can play a role in ensuring that the path of opportunity is open to everyone. When all have the opportunity to succeed, Minnesota’s economy and quality of life are stronger.
Minnesotans have been served well by public investments. Minnesota is a leader in covering the uninsured and graduating our students from high school. Our state economy outperformed the national average for many decades.
However, Minnesota’s responses to fiscal challenges in this decade raise questions about whether the state has maintained its commitment to public investments. The Lost Decade asks: what is the status of Minnesota’s investments in some of the areas important to the well-being of its residents and ensuring that all have the opportunity to succeed?
Looking at the largest and most flexible part of the budget, we find that the state’s general fund spending has increased five percent from FY 2000 to FY 2009. (This figure and all measures of changes over time in this analysis have been adjusted for inflation.) But the story varies significantly among different areas of the budget. State general fund spending in transportation, higher education, aids to local governments, heath and human services, environmental resources, and economic and workforce development are all lower at the end of this time period than at the beginning. Other areas have grown over time beyond the rate of inflation, including education, health care and public safety.
But just knowing whether spending in a subject area has grown or shrunk does not tell the whole story. The Lost Decade takes a closer look at four areas of the budget that significantly impact the well-being of Minnesota families and are important for ensuring that all Minnesotans have the opportunity to succeed. These areas are:
- Early childhood through grade 12 (E-12) education
- Higher education
- Child care assistance
- Affordable housing and homelessness prevention
In each area, we examine state funding trends from FY 2000 through FY 2009, the policy choices that influenced that funding trend, and the implications for Minnesotans’ quality of life and access to opportunity.
Minnesota policymakers confronted budget deficits from 2002 to 2005 and again in 2008, with particularly large deficits in 2002 and 2003. The Governor and Legislature enacted considerable cuts in funding in response to these deficits, so our finding that all four areas studied showed a decline after FY 2003 is not surprising.
Whether the decline in funding since FY 2003 has been somewhat modest, as in E-12 education, or more dramatic, as in higher education and child care, the 2000s can be categorized as a lost decade in which many Minnesotans found their opportunities to succeed in school, the workplace, or in providing a decent standard of living for their families were constrained. During these years, Minnesota also lost ground compared to other states.
Key findings in E-12 Education

- Minnesota is now average in its education spending compared to other states. In FY 1987, per pupil education spending in Minnesota was 11 percent above the national average. By FY 2006, Minnesota’s per pupil spending was equal to the national average.
- School districts now rely more on property taxes. A decline in state aid to schools since FY 2003 has resulted in a modest reduction in total school revenue and a significant increase in school property taxes.
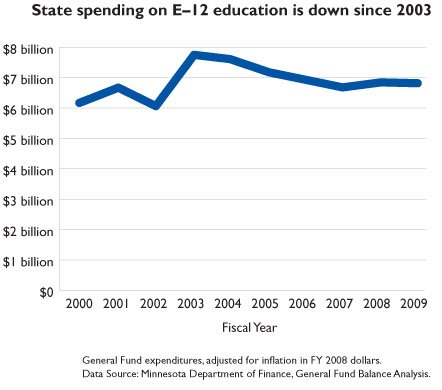
- State general fund spending on E-12 education rose by 10 percent from FY 2000 to FY 2009. A major tax reform meant that in FY 2003, about $1 billion in school funding was taken off of local property taxes and replaced by state funding. However, state E-12 funding has gradually declined since FY 2003.
Key Findings in Higher Education
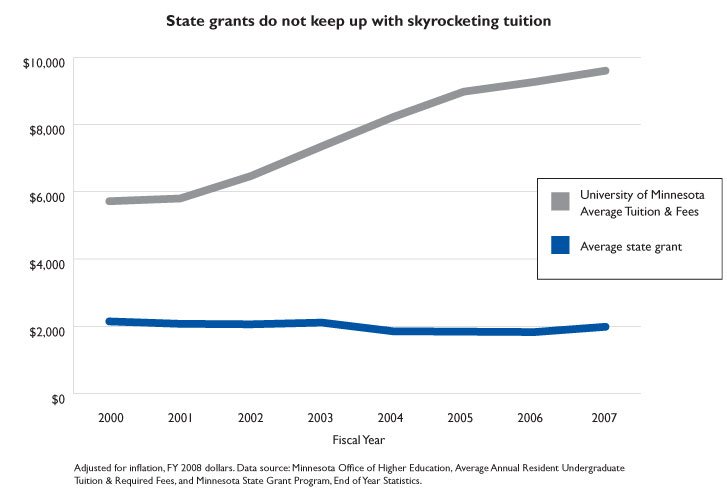
- In-state tuition increased by 68 percent at the University of Minnesota from 2000 to 2007. Average tuition in the Minnesota State Colleges and Universities system (MnSCU) rose by 55 percent over the same period. At the same time, the average state grant amount actually decreased by seven percent.

- Minnesota’s ranking among states in state funding for higher education dropped from 12th in FY 2001 to 35th in FY 2006, as a share of personal income. And although Minnesota is below-average in state funding for higher education, it is above-average in the cost of attending public institutions.
- State general fund spending on higher education dropped 16 percent from FY 2000 to FY 2009. Significant cuts earlier in the decade were partially restored in recent years.
- State higher education funding per full-time student dropped by 28 percent from FY 2000 to FY 2007.
Key Findings in Child Care Assistance

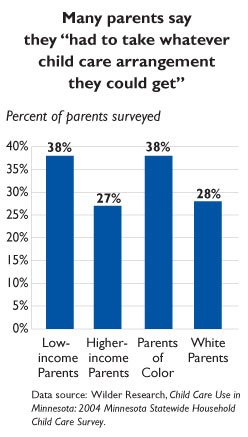
- Minnesota severely weakened its child care assistance programs as a viable support for working families as a result of severe cuts made in the 2003 and 2005 Legislative Sessions. Policymakers tightened eligibility requirements, increased out-of-pocket costs for parents and froze reimbursement rates for child care providers.
- 11,000 fewer children accessed child care assistance in October 2005 than in June 2003, after deep cuts were made to child care funding.
- State general fund spending for child care assistance dropped by 26 percent from FY 2000 to FY 2009. Increased federal funding made up for some of the lost dollars, but total federal and state child care spending in Minnesota in FY 2009 is still 16 percent below FY 2000 levels.
- The state cut funding for child care assistance by a cumulative total of $250 million from FY 2004 to FY 2007.
Key Findings in Affordable Housing
- The number of households in Minnesota spending more than half of their income on housing more than doubled from one in 15 households in 2000 to one in eight households in 2006. Minnesota had the fastest growth in the nation in this measure.
- State funding for affordable housing and homelessness prevention gradually declined, with the exception of two one-time boosts in funding. From FY 2001 to FY 2009, funding fell by 17 percent.
Decisions about how we spend state dollars matter more than ever. Indications are that our proud tradition of a strong state economy and a high quality of life is at stake. Since 2004, Minnesota has performed below the national average in key economic indicators such as growth in gross domestic product and personal income. At several points in 2008, Minnesota’s unemployment rate was higher than the national average for the first time in the thirty years that records have been kept. And most Minnesotans have seen little improvement in their standard of living since the beginning of the decade. Through a mulit-year economic recovery, median household income in Minnesota actually decreased from $58,400 in 2001 to $55,800 in 2007, in inflation-adjusted dollars.
Minnesotans need to have a statewide conversation about how we will reverse these trends and maintain a high quality of life and an economy that provides everyone the opportunity to succeed. The findings in The Lost Decade should provide some context for that conversation.
Methodology
Data sources: The analysis of trends in state spending in this report is based on data from the Minnesota Department of Finance and the Minnesota Department of Human Services.
Inflation adjustments: All data used to examine changes over time have been adjusted to reflect changes in the buying power of the dollar using the Implicit Price Deflator for State and Local Government Purchases. As a result, an increase in spending found in this report means that spending grew more than inflation. A decrease in spending includes the nominal cut in funding plus the lost buying power due to inflation.