The Census Bureau released new data today showing a 0.5 percent reduction in national poverty rates, making 2018 the fourth consecutive year where the official measure of poverty in America decreased. However, while this indicator is trending in the right direction, a closer look reveals that many of the benefits of the nation’s economic recovery are not trickling down far enough. We can and should do more to build widespread opportunity and shared prosperity for all.
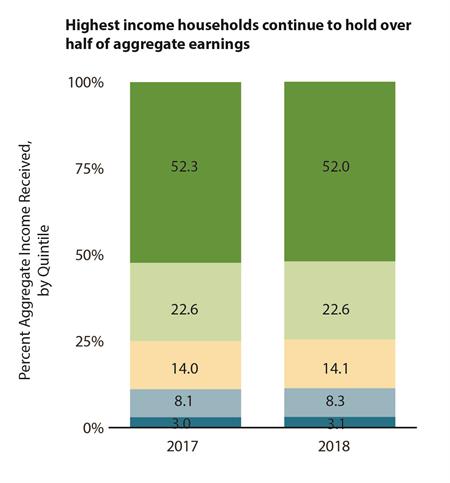
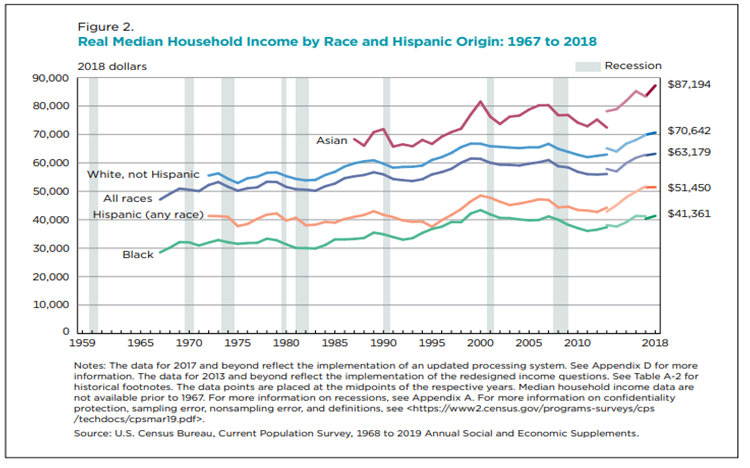
A decade after it ended, the aftermath of the Great Recession is still reverberating and the recovery has been slow and unequal. On the positive side, nationwide median earnings and the number of full-time year-round jobs increased. The official poverty rate continues to decrease and finally dropped below pre-recession levels, and 1.4 million fewer Americans are living in poverty in 2018 compared to 2017. However, current economic conditions are not boosting economic opportunity for all. Median household income stayed flat after several years of increases, and is still not much different from pre-recession peaks in 1999 and 2007. The top 20 percent of households took in 52 percent of aggregate earnings, while the bottom 20 percent of households see only 3.1 percent of that aggregate earnings. This inequality has not changed much from previous years, as illustrated in the graph below.

National median household incomes and poverty rates also show major differences by race. Due to the history of discriminatory policies and institutional barriers to opportunity, Black and Hispanic households have the lowest median household incomes and the highest rates of poverty. Nationally, Black households have the lowest median household income at $41,361. While Asian households are the demographic group with the highest median household income at a national level, it is also important to note that there is a wide variety of experiences within the Asian communities and we expect to dive into a more nuanced analysis of Minnesota information as the Census Bureau publishes more detailed state-level data. We also acknowledge that the Census data released today does not include detail about Native American communities. It is critical to have meaningful, disaggregated data on Native peoples and all communities to fully illustrate the story of our economy and how it’s impacting people.

The Supplemental Poverty Measure (SPM) is a more modern way to measure whether Americans are able to afford the basic essentials, compared to the Official Poverty Measure. It includes the effects of anti-poverty efforts like SNAP, targeted tax credits, and low-income heating assistance, as well as how much basic needs cost. In previous years, we’ve seen investments in key supports result in better outcomes for working families; however, in 2018 the national SPM rate did not improve in a statistically significant way. According to the Official Poverty Measure, in Minnesota 8.7 percent or 489,000 people live in poverty, while the Supplemental Poverty Measure pegs the estimate at 7 percent of Minnesotans, or 394,000 people. Minnesota is one of 24 states where Supplemental Poverty Measure rate was lower than the Official Poverty Measure, which could mean that state efforts to combat poverty are working.
In addition to measuring income and poverty, the Census data includes measures of health insurance coverage. After years of progress, access to health insurance is now trending in the wrong direction. Due to the Affordable Care Act, also known as “Obamacare” or the ACA, the share of Americans going without health insurance dropped significantly through the 2010s. Minnesota’s uninsured rate of 4.4 percent is among the lowest in the nation, but did not change from 2017 to 2018. However, the number of Americans without health coverage rose to 8.5 percent – a 0.5 percent increase from 2017. Private insurance coverage did not change significantly; increases in the uninsured rate all occurred within public programs, and Medicaid in particular saw a 0.7 percent decrease in coverage. This could be due to actions of the Trump administration to undermine or eliminate the Affordable Care Act, including efforts to repeal the ACA, reduced funding for outreach and enrollment assistance, and anti-immigrant policies that may have caused eligible families to forgo enrollment in Medicaid. Policymakers should take note of the negative impacts here, and take action to make sure families have access to medical care when they need it.
Today’s data release demonstrates that smart policy choices, like investments in expanding access to affordable health care, can lift families out of poverty and boost incomes. However, it also illustrates how weakening these policies, as we’ve seen in the last two years, can result in greater hardships for families working hard to put food on the table or keep a roof over their heads. We have the opportunity to become a state where people are able to work hard and get ahead, and we have more work to do to strengthen anti-poverty efforts so that all can share in the economic opportunities and thrive.
November 4, 2019 Note:This blog was edited to reflect updated data from the Census Bureau.