Recent Trends Erode Fairness of Minnesota’s Tax System
Every two years, the Minnesota Department of Revenue puts out a comprehensive report about state and local taxes. This year’s Tax Incidence Study finds that Minnesotans paid an average of 11.2 percent of their incomes for all state and local taxes. This measure has dropped by 13 percent since 1996.[1]
But this year’s Tax Incidence Study also shows some disturbing trends about how the responsibility for paying taxes is distributed.
- The highest-income Minnesotans pay a smaller share of their incomes in total state and local taxes than the average Minnesotan — and the gap is growing.
- Increasing reliance on local taxes — especially the property tax — has contributed to this erosion of tax fairness, as has rising income inequality.
Trends in Taxation
Since 1990, tax fairness in Minnesota has declined, with an especially large change from 2004 to 2006. This is demonstrated through a significant drop in the Suits Index, which measures the degree to which a form of taxation correlates to ability to pay.[2]
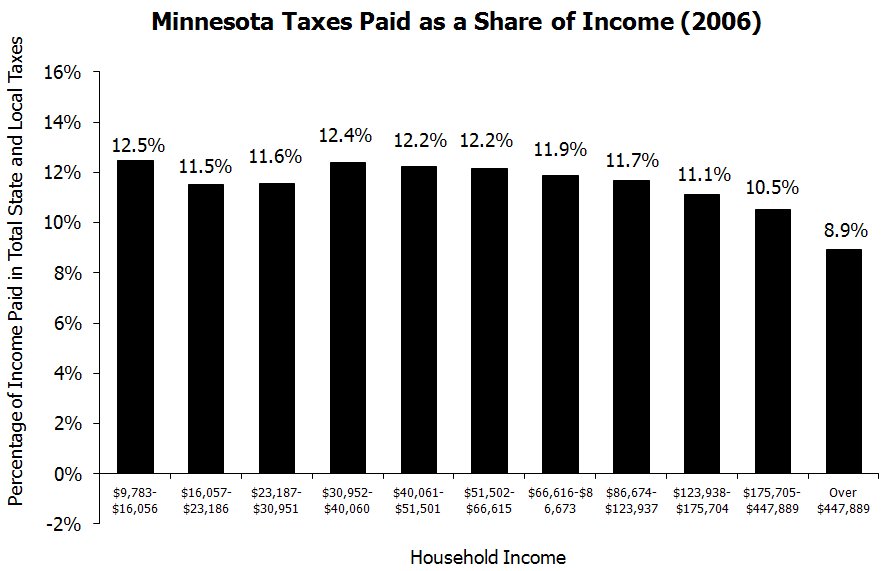
In 2006, the wealthiest one percent of Minnesotans (those with household incomes over $447,889) paid 8.9 percent of their incomes in total state and local taxes, compared to the average for all taxpayers of 11.2 percent.[3]
Two factors explain the gap. One is growing income inequality. In other words, the benefits of economic growth went disproportionately to those with the highest incomes. But policy choices are also part of the picture. Perhaps the most important is the ongoing shift in the mix of taxes, away from state taxes to more reliance on local taxes — especially property taxes, which are based on home value and not as closely linked to someone’s ability to pay. In 2006, local taxes made up 27 percent of total taxes, and this is projected to rise further to 32 percent in 2011.
Taxes are a smaller share of Minnesotans’ household budgets today than in the mid-1990s. This reflects decisions made by Minnesota policymakers about how to allocate projected budget surpluses. Between 1997 and 2001, taxes were cut significantly. One-time rebates totaling $3.7 billion were enacted in each legislative session between 1997 and 2001. Permanent tax cuts were made in each of the surplus years: property taxes were cut in the 1997, 1998, 1999 and 2001 Legislative Sessions, income taxes in 1999 and 2000, and motor vehicle registration taxes in 1999.
These tax reductions, coupled with income growth, mean that Minnesotans are paying less in taxes as a share of income. On average, Minnesotans paid 11.2 percent of their incomes in state and local taxes in 2006. This was down from 12.9 percent in 1996 — a drop of 13 percent.
The average tax paid is projected to rise slightly to 11.4 percent in 2011. Again, both income trends and policy choices contribute to this situation. The continuing shift towards greater reliance on residential property taxes to fund services in Minnesota is expected to be a significant contributor to the expected increases in 2011. In fact, the share of income spent on state taxes is expected to fall, but will be more than offset by large increases in local taxes.
In 2005, Minnesota instituted an additional tax on cigarettes and other tobacco products that was called a Health Impact Fee, despite being structured identically to the state’s existing cigarette and tobacco taxes. The fee is not included in the overall analysis in the Tax Incidence Study, but the Department of Revenue reports that incorporating the Health Impact Fee into the analysis would result in average taxes that are higher as a percentage of income (11.4 percent of income, up from 11.2 percent) with the impact falling heaviest on low-income people.
Tax Shares Vary With Incomes
The actual share of income that Minnesotans pay in state and local taxes varies according to their income. Which taxes a household pays also varies with income. Lower-income Minnesotans pay a larger share of their incomes in regressive sales and property taxes, while higher-income Minnesotans pay a larger share through the state income tax.

The difference in how various income groups pay their taxes is important to keep in mind when evaluating the overall structure of Minnesota’s state and local taxes. For example, the less the system relies on income taxes, the higher share of household income will be paid by low- and middle-income Minnesotans. So if any particular tax is raised or lowered, the impact will not be evenly felt “across the board,” but will depend on how much that tax contributes to the taxpayer’s total tax bill.
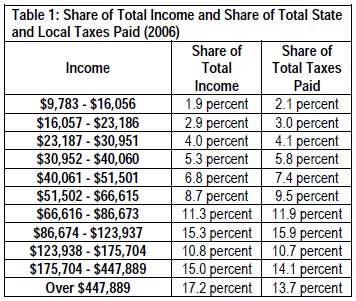
Another way of measuring tax distribution is by comparing how much each group pays in relation to its share of total income in the state. As shown in Table 1, most income groups in Minnesota pay roughly in proportion to their share of total income, although middle-income groups tend to pay slightly more than their proportionate share and the highest income groups pay less. The income group with the largest difference between its share of total state income and its share of total taxes paid is those with household incomes over $447,889 (the wealthiest one percent). This group of Minnesotans had 17.2 percent of all income in the state, but paid 13.7 percent of total taxes.
Each Tax Varies in its Impact
The degree to which any form of taxation correlates to ability to pay can be measured by a formula known as the Suits Index.
As shown in Table 2, Minnesota’s estate tax and individual income taxes are the state’s only progressive taxes – meaning that the higher one’s income, the larger share of that income that goes to paying the tax (and a Suits Index above zero). All other taxes that Minnesotans pay are regressive, making up a higher percentage of a low- or middle-income household’s income than for the wealthiest households. Taxes on gambling and on cigarette and tobacco products do this to the greatest extent.

In Minnesota, the income tax only partially offsets the impact of other state and local taxes on low-income and middle-income households.
Policy Implications
While levels of taxation and degrees of fairness are impacted by income trends, policy choices matter. The data from the Tax Incidence Study can be used to help inform policy choices that ensure that Minnesota’s tax system is both fair and raises enough revenues to fund the state’s needs.
When considering how to improve the state and local tax structure, Minnesota policymakers should take into account the main facts. First, the difference between the share of income that the wealthiest pay in taxes and the share that the average Minnesotan pays has grown. Reversing that trend should be a priority. Second, taxes are a lower share of Minnesotans’ income today than in the mid-1990s, and are not raising adequate revenues to avoid persistent budget deficits.
Tax Incidence Study Methodology
The Tax Incidence Study includes over 99 percent of the $22.1 billion in taxes paid in Minnesota in 2006. The distributional analysis in the study includes only the $18.5 billion paid by Minnesota residents (84 percent of the total). It excludes the remainder, which is paid by nonresidents. The study also does not include the impact of fees.
The Tax Incidence Study provides estimated taxes for 2011 based on existing laws; these projections do not assume any policy action to change tax laws by the 2009 Legislature.
In the Tax Incidence Study, “income” includes taxable income as well as nontaxable income such as public assistance, tax-exempt interest, and nontaxable social security and pension income. A “household” is defined as “an actual or potential income tax filer and all dependents, even if not all living under the same roof.” This varies from the Census, which defines a household as all persons who live together in a housing unit. For this reason, the Tax Incidence Study has a larger number of households than the Census, and the median household income is less than reported by the Census.
[1] The data in this analysis come from the Minnesota Department of Revenue, 2009 Tax Incidence Study. The opinions expressed are those of the authors.
[2] The erosion of fairness is demonstrated by the Suits Index, which measures the degree to which a tax is regressive or progressive. The Suits Index assigns a number between –1.0 and 1.0. A proportional tax has a Suits Index of 0. A progressive tax has a positive Suits Index and a regressive tax has a negative Suits Index. The Tax Incidence Study finds a large drop in the Suits Index for Minnesota’s total state and local tax system from -0.024 in 2004 to -0.053 in 2006. The system is expected to improve slightly in 2011 to a Suits Index of -0.051. And the situation could be even worse — using an alternative method, the Tax Incidence Study measures a Suits Index of -0.062 in 2006 and -0.061 in 2011. This alternative methodology uses the entire sample of 93,000 data points to calculate the Suits Index, in contrast to the traditional approach of using 10 data points. The Tax Incidence Study notes that the “full sample” method is theoretically preferable, but they use the traditional method so that results can be compared to past studies.
[3] The Tax Incidence Study divides the population into ten groups containing an equal number of households, called deciles. The tables and graphs in this analysis show the results for the second through ninth deciles, and then the tenth decile is divided into the first five percent, next four percent and top one percent. Data concerns regarding the first decile results in the Tax Incidence Study overstating the level of taxation for this group. For this reason, the first decile is not included in graphs and tables in this analysis. The actual taxes paid by any particular household will depend on factors such as family size, marital status, whether the family owns or rents their home, and eligibility for various tax deductions and credits.