A Joint Release from the Minnesota Budget Project and Children’s Defense Fund-Minnesota
From 1997 through 2001, thanks to strong economic growth, Minnesota’s state leaders had the opportunity to allocate budget surpluses of over $13 billion. Decisions about how the surpluses were used reflect those leaders’ priorities and set the stage for how prepared we are to deal with the current economic downturn. The state now faces a nearly $2 billion deficit. Budget balancing decisions should be informed by how surpluses were divided between tax cuts and spending, and how certain programs were underfunded even in times of plenty.
Our analysis finds:
- Of the total surplus dollars allocated in 1997 through 2001, more than half were spent on tax cuts and rebates. Less than one third were spent on improving or expanding services.
- Certain funding areas, particularly health and human services and children and families, received almost no surplus dollars for the entire five-year period. The health and human services area actually contributed more to the surplus than it received, as state investments were replaced by federal funds.
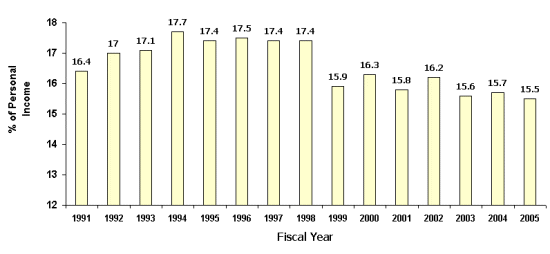
- Even though some of the surplus went to increased spending, the portion of Minnesotans’ incomes going to state and local government has declined, as measured by the Price of Government. The Price of Government has actually declined from 17.4 percent in 1997 to 16.2 percent in 2002.
How We Used Our Surpluses
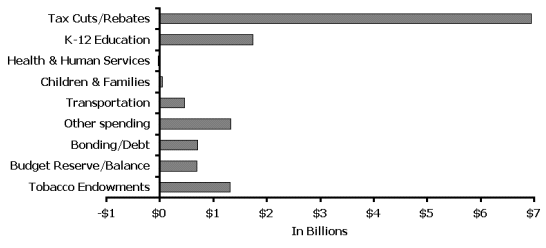
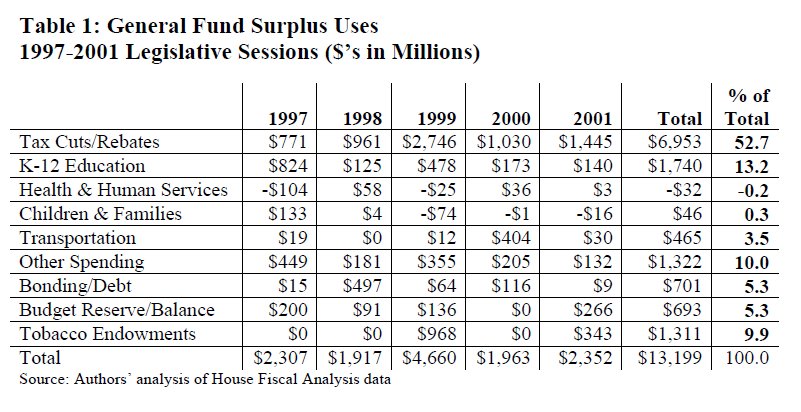
Chart 1 and Table 1 illustrate how the $13 billion in surpluses were used. The majority, 53 percent or $7 billion, was allocated toward tax cuts, which were divided nearly evenly between rebates and ongoing tax cuts. An additional 15 percent of the surplus, or $2 billion, was set aside either in endowments or budget reserves. Only 27 percent of the surplus total, or $3.5 billion, was spent on improving or expanding services, with the remainder going to bonding and debt service.
Chart 1: Using the Surpluses, 1997-2001 Legislative Sessions

Source: Authors’ analysis of House Fiscal Analysis data. “Children and Families” includes budget activities such as child care services, community education, lifelong learning, and libraries. “Other spending” includes higher education, environment and natural resources, state government, crime and judiciary, economic development and housing, and other special appropriations.

The investments made from the surplus were relatively small compared to the total resources available: 13 percent of the surplus went to K-12 education, four percent was devoted to transportation, and 10 percent went to various other expenditure categories.
Almost no progress was made in areas critical to Minnesota’s struggling families. In many years, the health and human services and children and families areas contributed more to the surplus than they received, as shown as negative numbers in Table 1. This occurred in two ways. First, state spending on family supports was much less than previously expected, due to dramatic drops in caseloads in the Minnesota Family Investment Program (MFIP), Minnesota’s welfare program. Second, existing state funding for family support programs was replaced by federal dollars from the Temporary Assistance for Needy Families (TANF) block grant. But instead of reinvesting the state savings in policies that would help struggling families, these funds were simply added to the already substantial surplus.
At the end of five years of surplus, the state still has not guaranteed affordable child care, provided adequate education and training needed for families to reach economic self-sufficiency, or eased the affordable housing crisis.
In addition to using the surplus for tax reductions and limited investments, policy-makers put some of the surplus funds aside for future needs. Over $1.3 billion in revenues from the state’s tobacco settlement — nearly 10 percent of the total surplus dollars — were set aside in endowments, with the interest used to support such services as medical education and tobacco prevention. Another five percent of the total surplus was used to increase the state’s budget reserve or was left as a balance for the next legislative session.
Lessons Learned: Putting Budget Decisions in Context
The 2001 Legislative Session should have been a turning point in state decision-making. Economic reports throughout the spring of 2001 made it clear that the state’s economic future would be less rosy than predicted. Yet rather than setting a significant portion of the surplus aside to help deal with future shortfalls, policy-makers spent most of the projected surplus in the 2001 Session, with the largest portion going to tax cuts and rebates.
Now the state is facing a deficit, and needs to bring the FY 2002-03 budget back into balance. While we believe that decisions made to address the state’s budget deficit should be informed by how the surpluses were used, others have argued that we need to rein in state spending. However, this argument is often based on misleading statistics about the growth of the state budget. To be fair and accurate, these numbers must be put into context.
When asking how much Minnesotans pay for government, the most comprehensive measure is the Price of Government. The Price of Government compares all state and local revenues including taxes, fees, and tuition (except those transferred from the federal government), and measures the total as a percentage of personal income in the state. Calculating burden as a percentage of income compares government revenues to Minnesotans’ ability to pay. Although government revenues have been growing, personal incomes have been growing faster. As a result, the amount of income Minnesotans spend on government has been getting smaller, as the graph below shows.
Graph 2: Price of Government, FY 1991-2005

Source: Department of Finance, November 2001 Forecast supplement
While there are valid reasons to contain growth in spending, the data simply do not show that state spending is rapidly growing out of control.
Addressing the Deficit
There is no question that difficult choices are ahead for Minnesota’s decision-makers. However, by using responsible fiscal decision-making, recognizing past budget decisions, and considering the impact of their decisions on vulnerable Minnesotans, policy-makers can make budget balancing decisions that put the state on the right track while not increasing the recession’s burden on those who are hurting most.